Visual management
Visual management is an effective management method.
It is based on the use of graphs, tables and other visual elements. It thus improves communication, collaboration and transparency in the company.
This approach helps simplify communication and decision-making by presenting complex information in an easy-to-understand visual form.
Overall, in the information that a person receives from his senses to manage his relationship to his environment, about 70% comes to him through vision. From this perspective, vision can be considered the most important sense
SourceWikipedia
Visual management in business
Visual management has its place in all sectors of the company. Let’s see how it is used in services.
Within production
This technique finds its usefulness during team points that we find in production.
For example:
- the 5-minute update between 2 teams: here it gives a clear view of the production in progress, the difficulties encountered and the actions to be taken.
- the maintenance point: here, it will give indications on the actions in progress, the Pareto of the causes of breakdowns and the follow-up of the preventive maintenance actions.
- the SQCDP: see the article on this subject.
- the performance point: it is aimed at production managers and identifies indicators such as the OEE, OEE or other indicator for measuring the performance of the industrial tool
In logistics
As mentioned above, we find the point teams. You can also find visual management materials such as:
store occupancy rate
material tracking information
here also the Pareto of the causes of dysfunction of the logistics activity
For management control
Managers need numbers to project themselves and make the right decisions. Thus the visual support used will provide the following information:
cost per product or product line
has constant product, manufacturing cost on one line rather than another
raw material cost impact
supervision of production units and concatenation of data
…
Web tool for visual management
A web application is easy to consult on all types of media (computer screen, tablet, smartphone, etc.) and the same screen can be seen in different places.
Thus, a manager can monitor plant data in real time from his office or directly in the workshop. If the house policy allows it, he can even follow it when he travels.
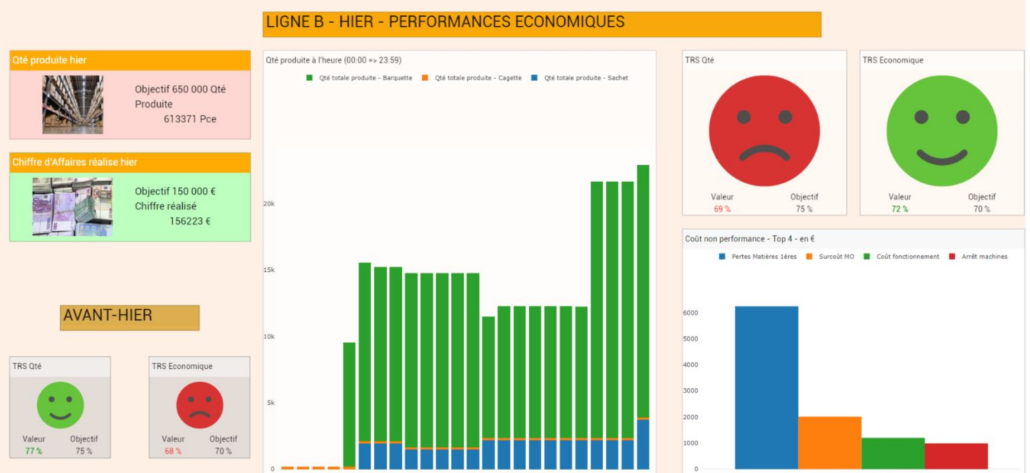
Atelog myScore offers an intuitive interface for building visual management dashboards. It relies on the different modules of the software suite. Thus, depending on the use case, the information reported addresses the right audience in the right format.
Visual management allows team members to see, for example:
- where is the project,
- what needs to be done,
- and who is responsible for each task.
This can help improve team efficiency and productivity by giving everyone a clear understanding of what is expected of them.
In addition to improving communication, visual management can also encourage innovation and creativity by providing a clear overview of challenges and opportunities to be seized. It can also help identify issues and bottlenecks, allowing the team to resolve them quickly and efficiently.
Conclusion
Ultimately, visual management is a powerful management method that can help companies collaborate better, work more efficiently, and achieve their goals faster. By using visuals to improve communication and transparency, teams can work smarter and more efficiently to reach their full potential.